emd-cloud Unified Platform for Asset Monitoring and Diagnostics
With emd-cloud, you can manage, monitor, and diagnose all your assets from a single, centralized platform. Easily upload custom CAN parameter tables and visualize real-time data, enabling you to identify failures or improper actions during asset operation. Gain complete control and deep insights to optimize performance and prevent issues before they escalate.

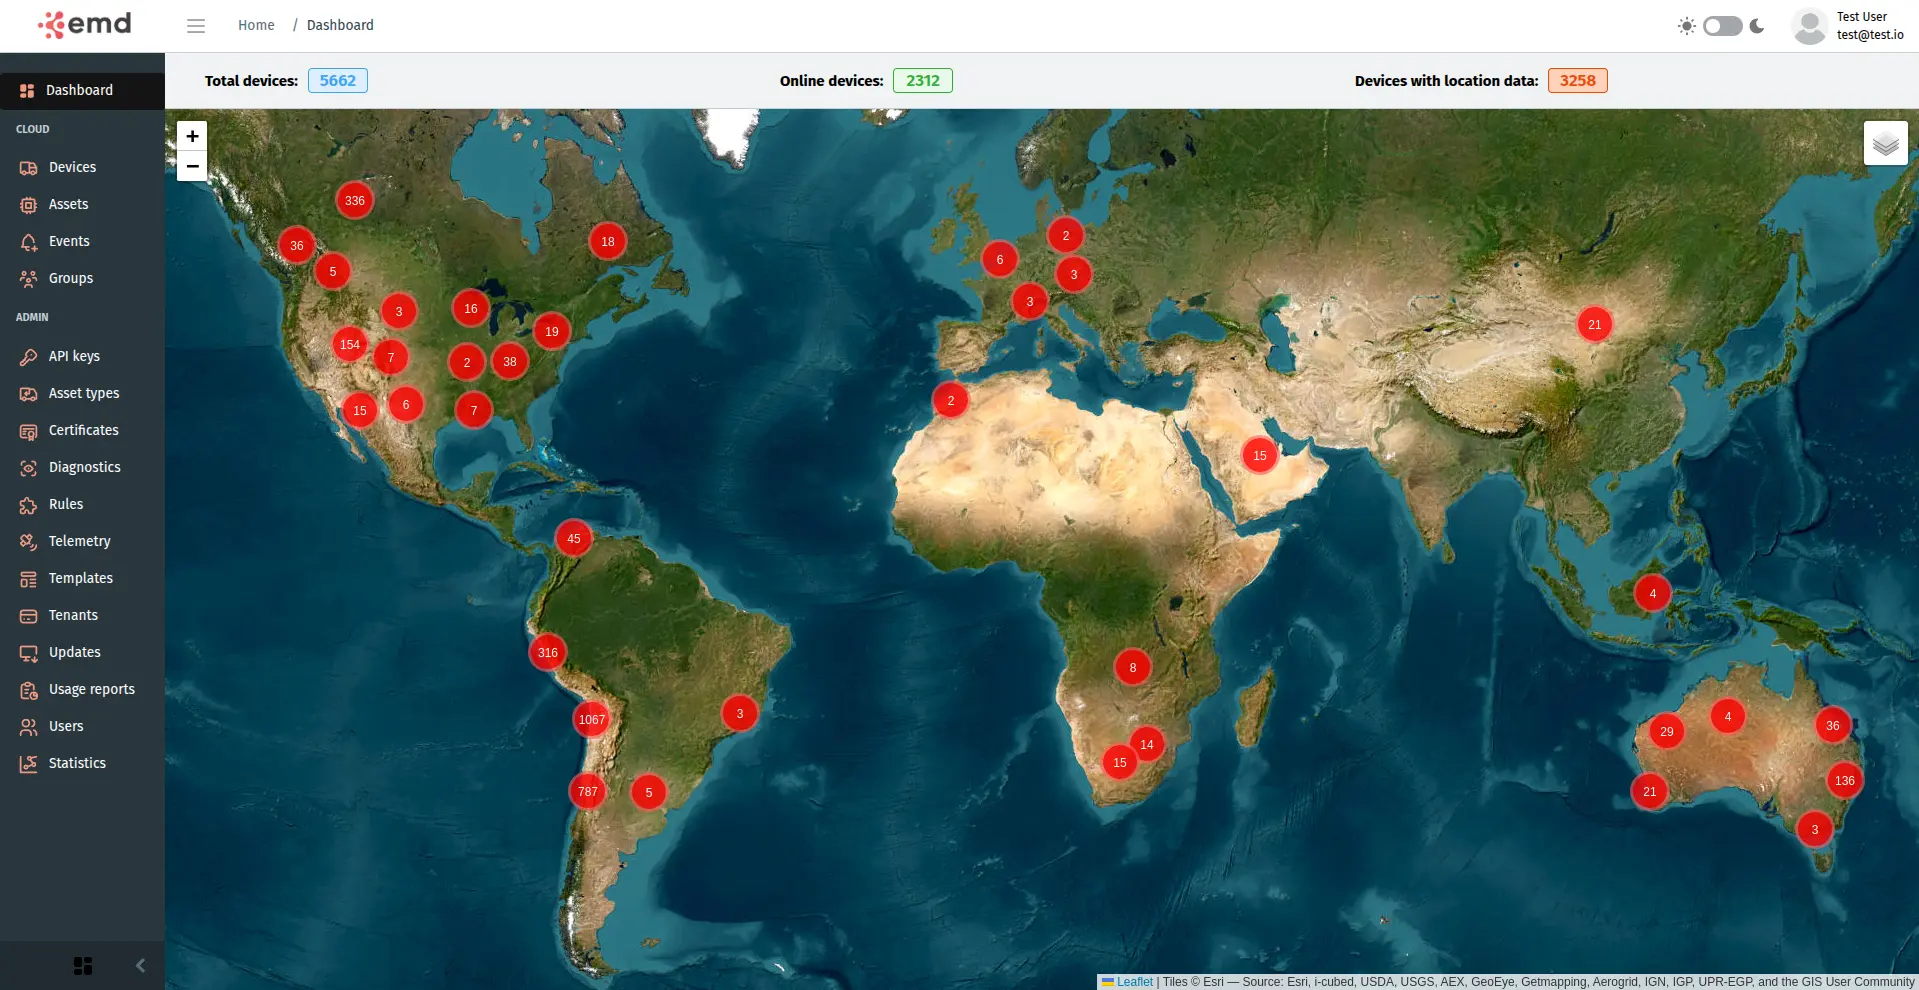
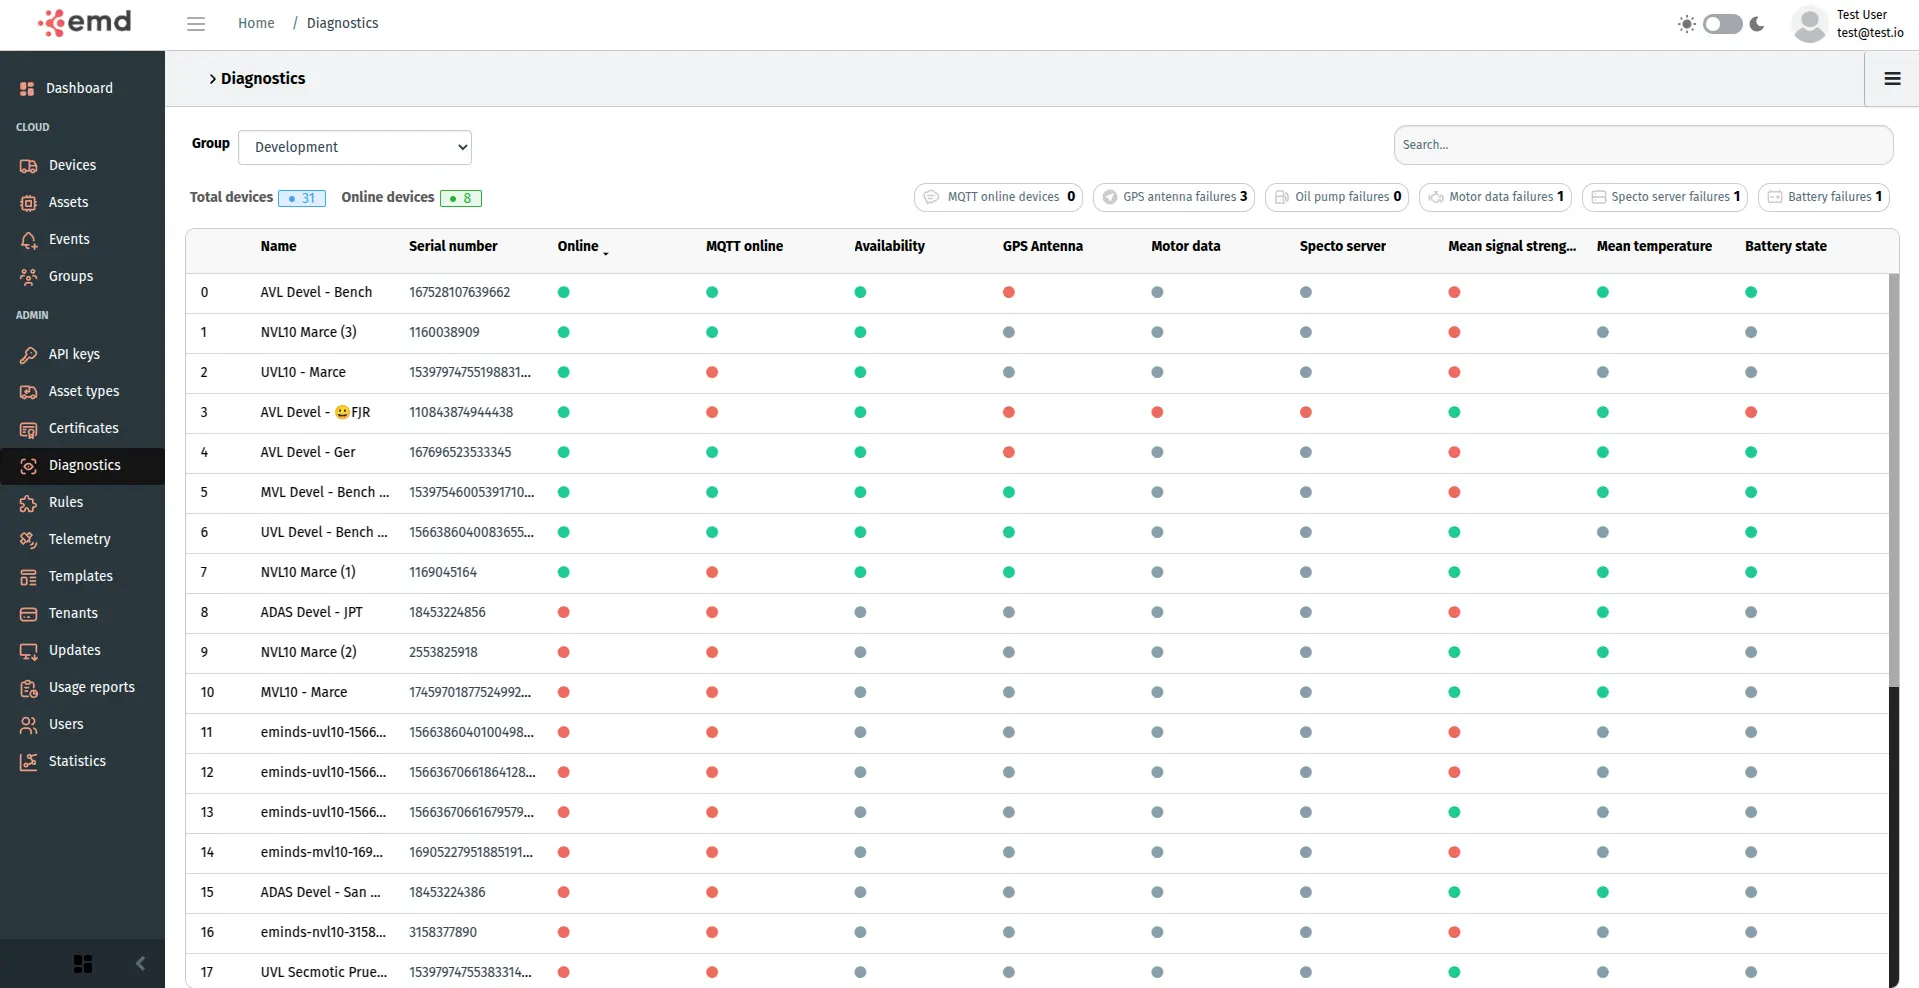
Complete Asset Management at Your Fingertips:
Access the admin module to monitor, configure, and update your assets with ease. Get real-time insights into power levels, battery status, temperatures, and OS performance, including CPU usage and memory availability.
Effortlessly provision, update, and monitor all your devices with a single click. Track connectivity status, signal strength, bus activity, and overall device health. View firmware versions and perform individual or batch updates to keep your system running optimally.
Easily customize and fine-tune device configurations, including APN settings, Wi-Fi, Ethernet, CAN, Modbus, and more, ensuring seamless integration and maximum efficiency for your operations.
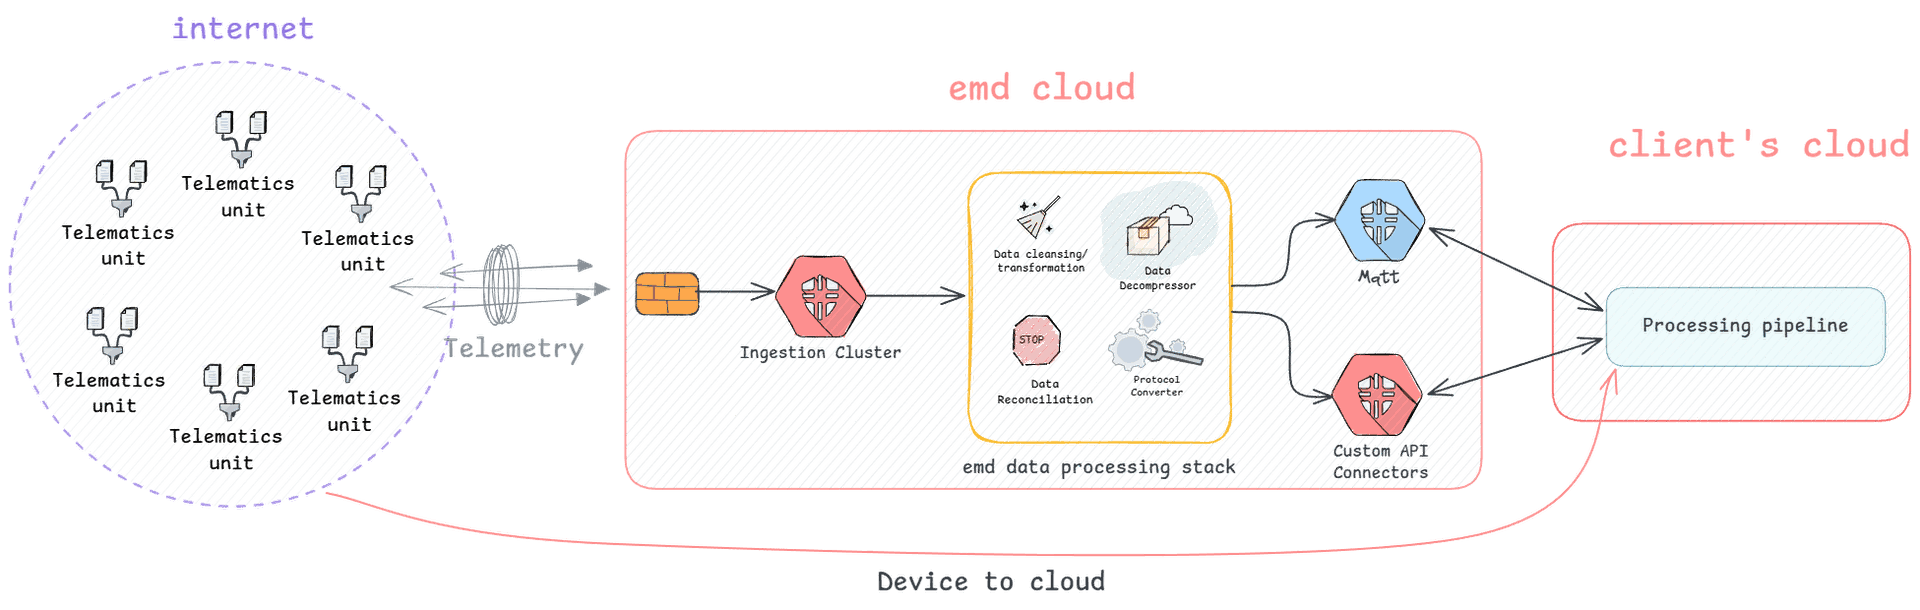
At emd, we go beyond device management, our platform was built from the ground up to meet the needs of large enterprises seeking advanced hardware and telemetry services. Our solutions are designed to streamline operations through a unified management system, enable direct communication between edge devices and enterprise services, and provide APIs that ensure seamless integration with your existing infrastructure.
With flexible architecture and powerful integration tools, emd makes it easy for you to embed your business logic directly into our telematics ecosystem—empowering your operations with smart automation, real-time control, and full visibility across all connected assets.
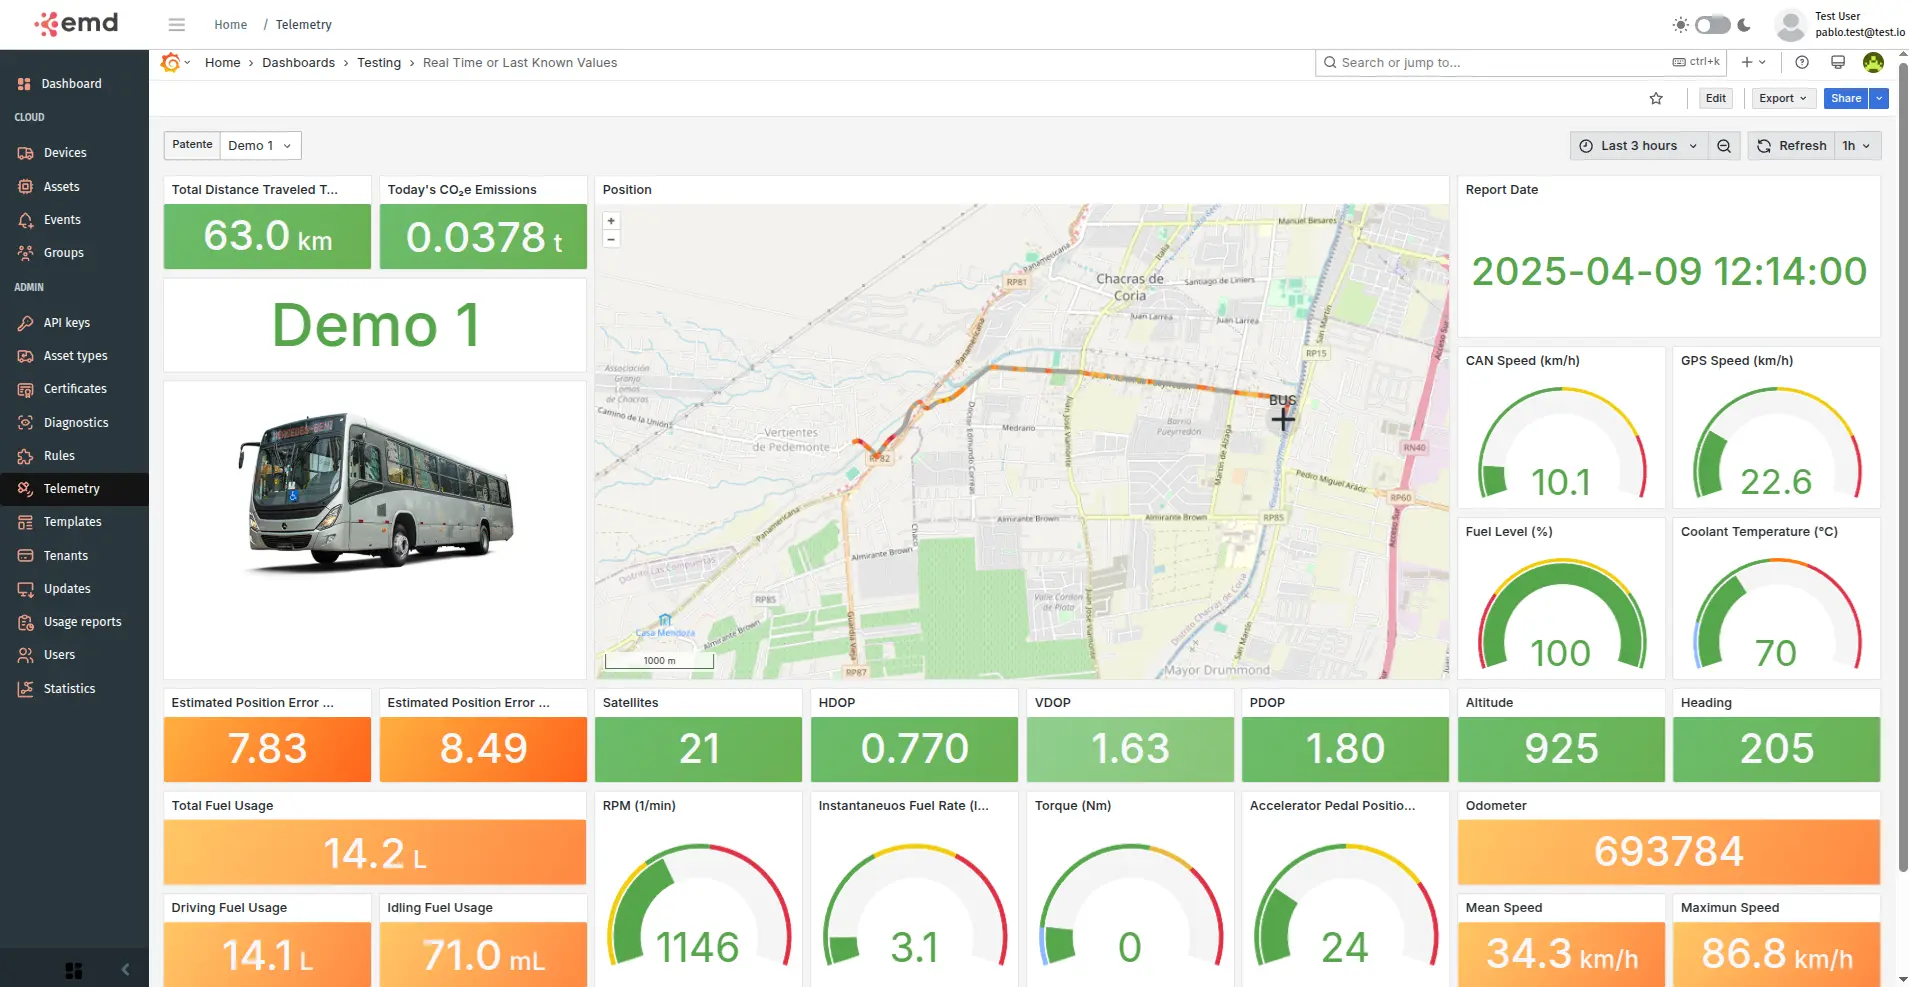
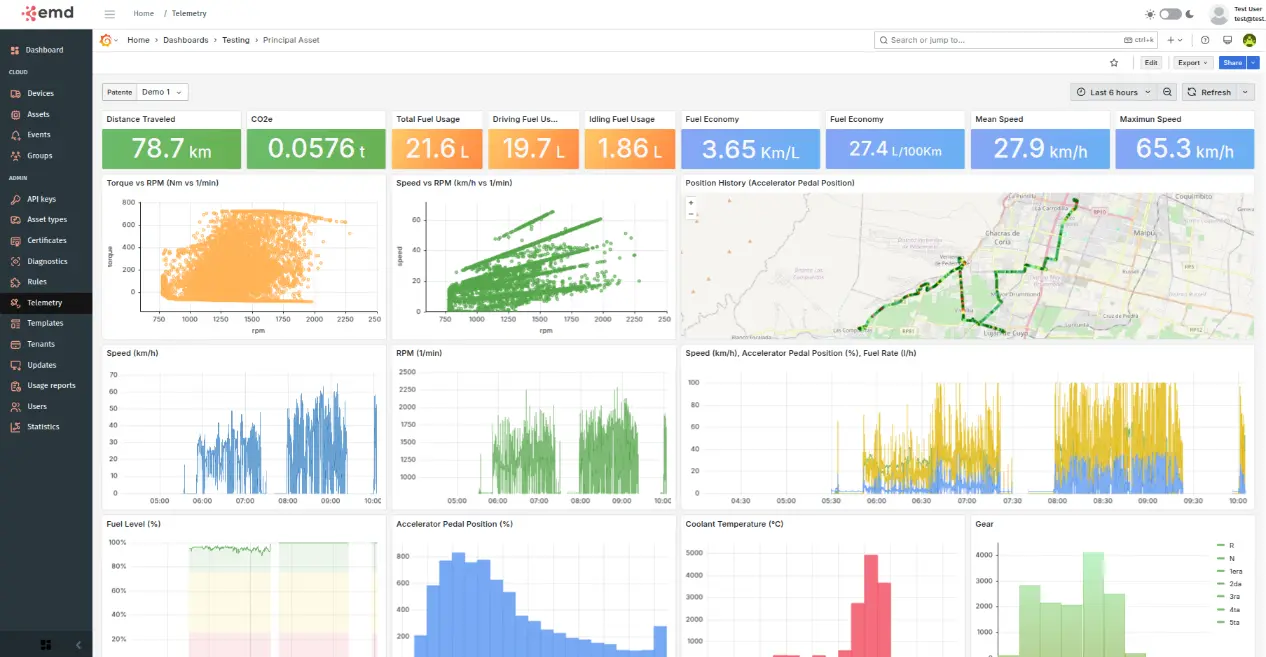
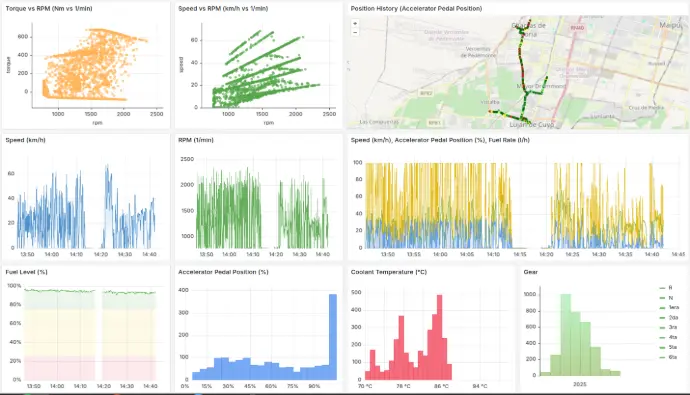
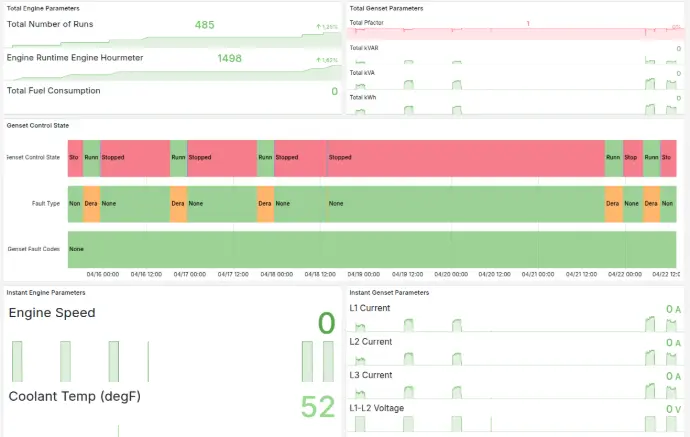
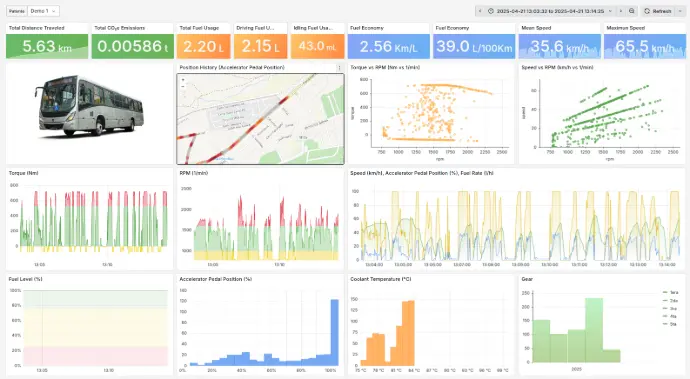
Fully Customizable Data Visualization
Leveraging the power of Grafana, we provide fully customizable dashboards designed to meet each customer's unique requirements. Easily integrate and visualize data from multiple sources, including CAN bus telemetry, GPS data, GPIO inputs, and more.
With flexible configuration options, you can tailor dashboards to display the most relevant insights, enabling real-time monitoring, advanced analytics, and improved decision-making for your operations.
Advanced CAN Logging
Our Advanced CAN Logging feature is designed to provide in-depth diagnostics and performance monitoring, ensuring you capture the most relevant and valuable data for your specific needs.
With customizable logging triggers, you can configure the system to start recording only when the CAN bus meets predefined filter conditions. This targeted approach allows for efficient troubleshooting, making it easier to identify and resolve specific operational issues without generating excessive, unnecessary data.
For broader analysis, you can also enable large-scale CAN logging, continuously monitoring critical parameters such as engine performance, sensor activity, or network stability. This helps in identifying anomalies, detecting early signs of potential failures, and optimizing overall system efficiency.
Key Features:
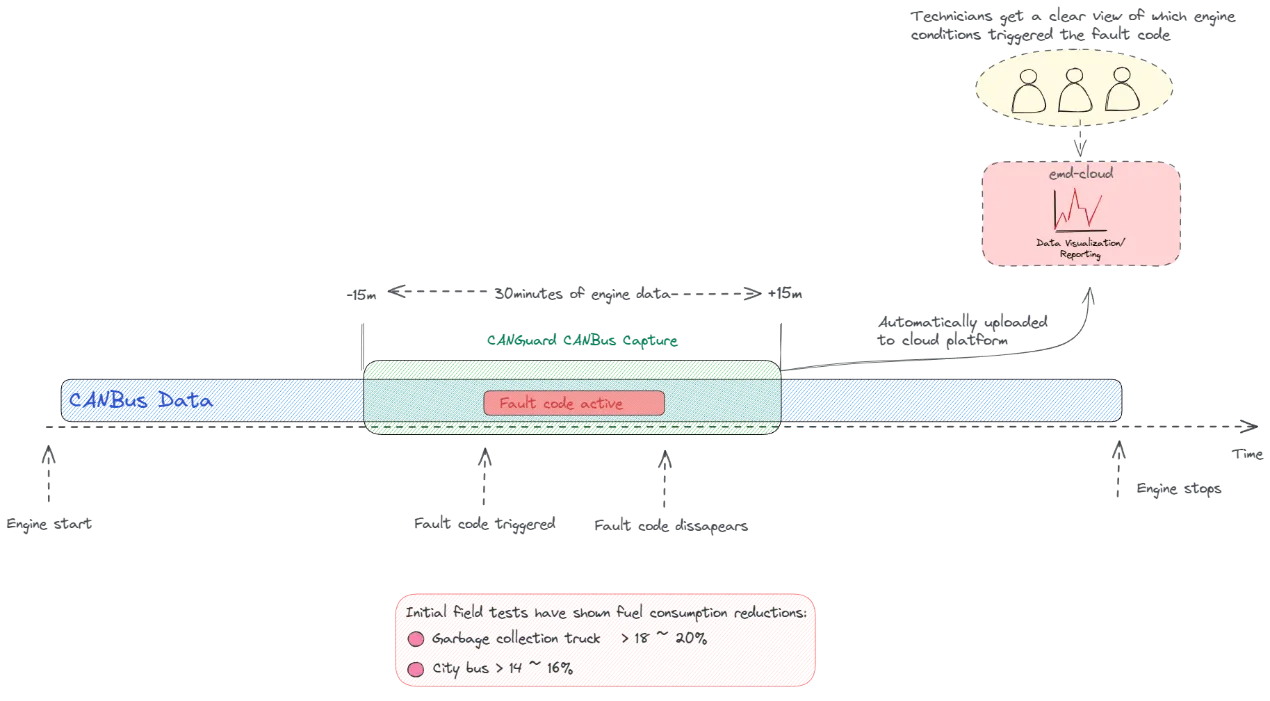
- Automated Telemetry Upload: Upon detection of a fault code, instantly triggers an upload of telemetry data spanning 30 minutes —15 minutes before and 15 minutes after the fault occurrence. This ensures that no vital data is lost, facilitating a thorough analysis of the event.
- Comprehensive Data Capture: The uploaded telemetry encompasses 100% of the data present on the CAN buses at the time of the fault, providing an exhaustive dataset for subsequent analysis. This complete snapshot allows for an in-depth understanding of all variables and parameters at play.
- Advanced Analytical Capabilities: With telemetry data from both before and after the fault event, CANGuard enables a detailed examination of variables involved in the triggering of the fault.
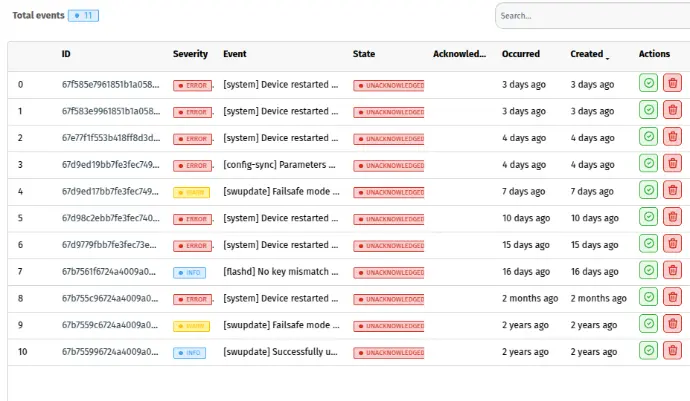
Real-Time Alerts & Custom Event Management
Our event monitoring interface provides a clear, real-time view of predefined events, including alarms, status updates, and critical notifications from your devices.
For enhanced flexibility, you can also create and configure custom events using our eFlow Manager system, allowing you to define specific triggers and conditions tailored to your operational needs. Stay informed and in control with proactive event tracking and instant notifications.
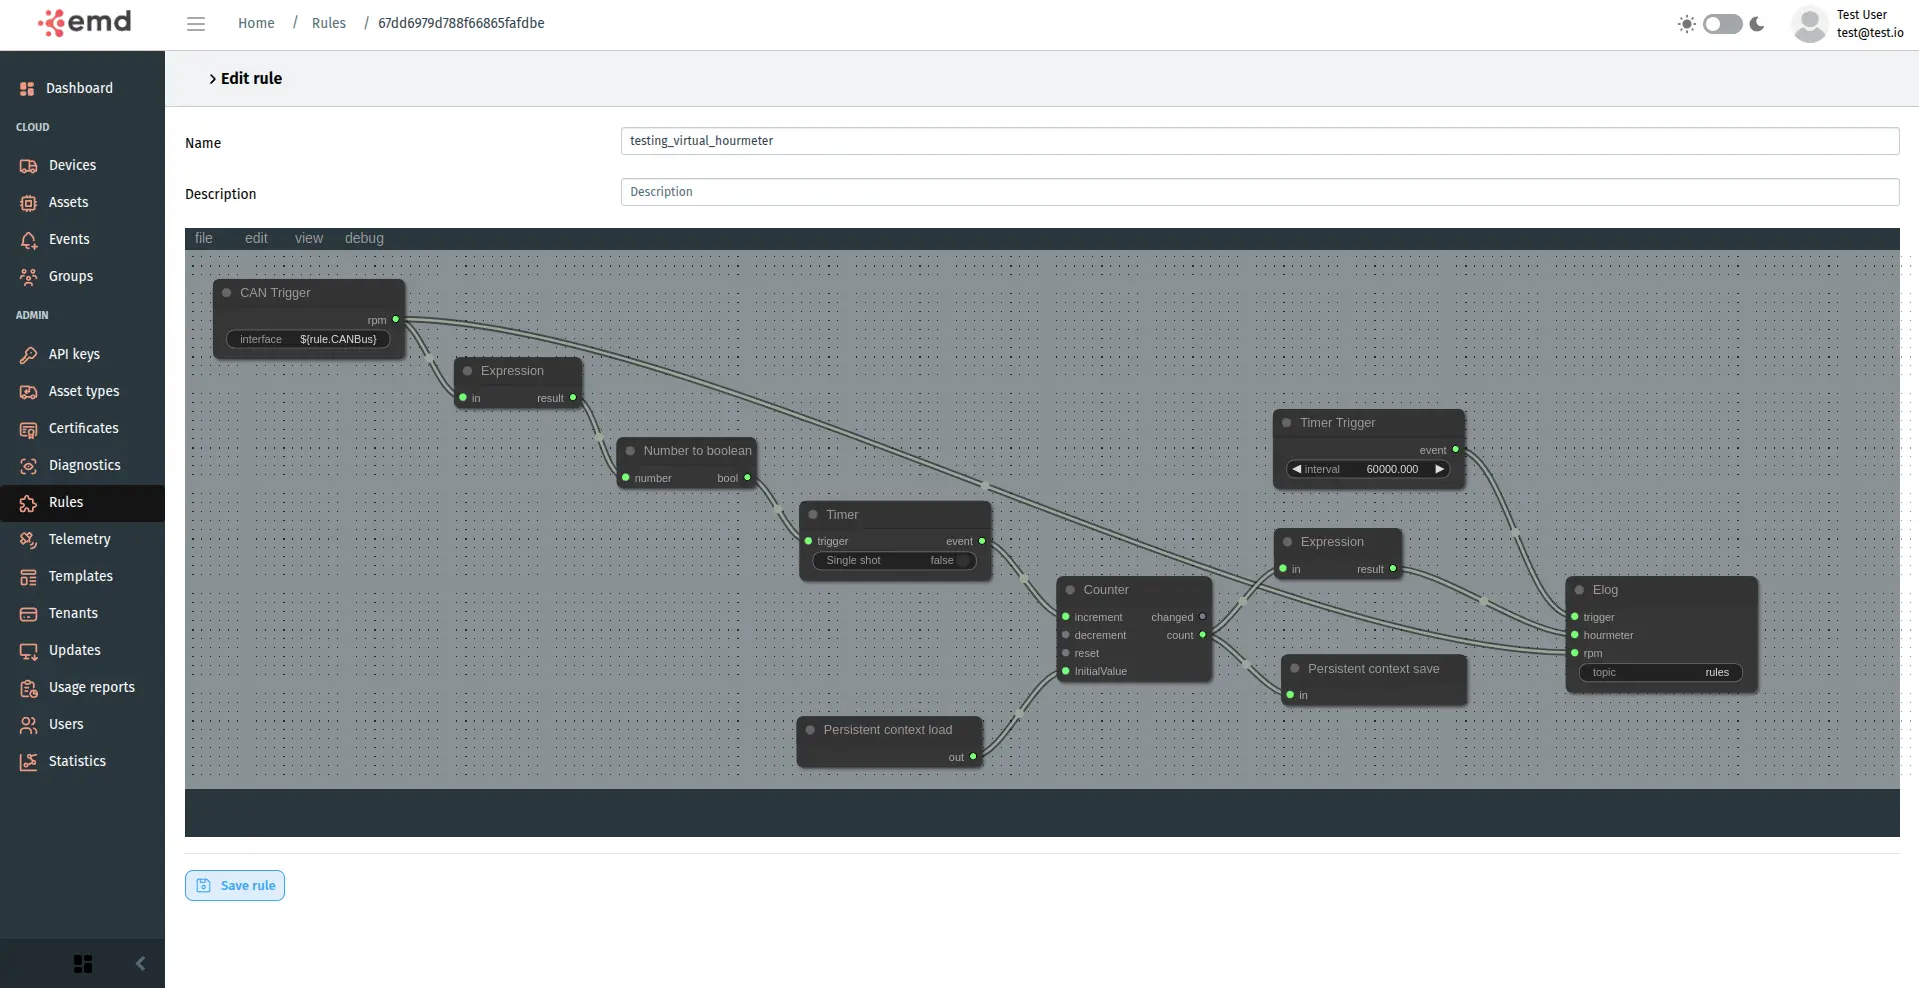
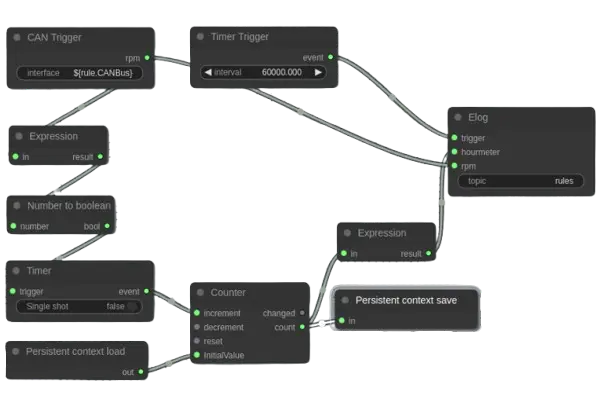
eFlow Edge Computing
Facilitates the easy deployment and management of applications on edge devices through its Edge Rule Engine. This powerful capability allows users to design and execute IoT business logic directly at the network's edge, significantly reducing latency and enhancing overall operational efficiency. A key feature is the seamless integration with TensorFlow Lite, bringing the power of machine learning to the edge. This enables the local execution of artificial intelligence inference tasks on resource-constrained devices with speed and efficiency.
Process data locally on your devices, send it to your private cloud, or visualize key insights through the emd Cloud platform. This ensures faster decision-making, optimized bandwidth usage, and greater control over your data.
Through our intuitive UI, you can easily create and customize edge processing rules by combining, triggers, operations and outputs
This flexible architecture allows you to adapt eFlow Edge Computing to your specific operational needs, enabling smarter, real-time decision-making directly at the edge.
eflow Triggers
- Location trigger
- IMU trigger
- Timer trigger
- CAN trigger
- GPIO trigger
- Network status trigger
- System events trigger
- Geofences trigger
- Etc
eflow Outputs
- Event
- File output
- elog
- GPIO Out
- GPIO Sequence Out
- GPIO PWM Out
- GPIO Radar Out
- Etc
eflow Operations
- Accumulator
- Arithmetic
- Sync
- Timer
- Latched comparator
- Event filter
- Orientation
- Expression conditional
- Etc
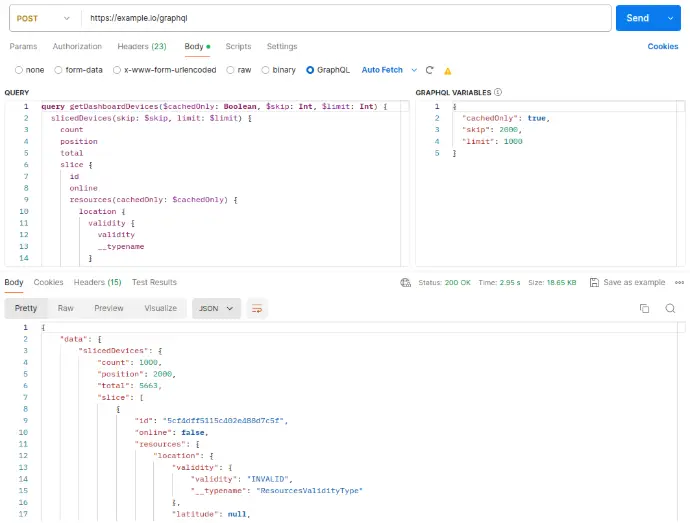
GraphQL API
Leverage our GraphQL API to effortlessly integrate real-time device data directly into your applications. Access and retrieve specific information from your devices with greater flexibility and efficiency, ensuring seamless communication between your systems and our platform. With precise queries, you get exactly the data you need—whether it's connectivity status, sensor readings, location data, event logs, firmware versions, or detailed telemetry from CAN bus (RPM, speed, fuel consumption, fault codes), Modbus registers, GPIO states, and more. This allows for optimized performance, reduced data overhead, and enhanced operational insights.
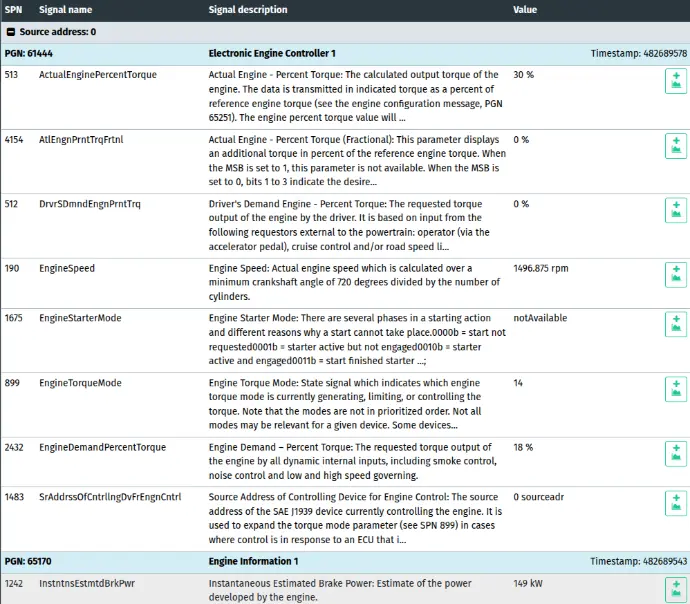
Custom CAN Data Acquisition with Enhanced Security
Our DAQ (Data Acquisition) module allows clients to securely upload and efficiently manage their own custom DBC tables, which define how to decode CAN bus parameters. These tables often contain proprietary, business-critical, and highly sensitive information that is essential for accurate asset monitoring, diagnostics, and in-depth performance analysis.
By enabling clients to work with their own custom DBC files, we ensure maximum flexibility, precision, and adaptability in data interpretation, while significantly minimizing the risk of exposing sensitive operational details. This client-driven approach reinforces data security, preserves confidentiality, and empowers users with full control over their telemetry configurations—fostering long-term trust in our platform and offering peace of mind when handling your most valuable asset data.
Real-Time Diagnostics & Remote Troubleshooting
With our Remote Technician Suite, you can stream real-time CAN data directly to your browser through a low-latency P2P tunnel, ensuring instant access to live vehicle operations.
Utilizing DBC templates, you can perform on-the-fly data conversions, making it easier to decode, analyze, and monitor critical parameters without physical access to the vehicle.
Additionally, our solution allows customers to remotely access the vehicle's J1939 network using RP1210 compliant OEM software, enabling remote diagnostics, troubleshooting, and repairs, all without the need to send a technician on site. This significantly reduces downtime and maintenance costs, improving operational efficiency and response times.
Virtual Sensors: Intelligent Data Estimation
Our Virtual Sensors feature enables the creation of new inferred data measurements by intelligently combining information from multiple interfaces, such as CAN, MODBUS, and onboard sensors.
This allows for advanced estimations, for example:
- Load estimation, such as calculating the approximate weight a truck is carrying based on suspension pressure and engine load
- Fuel efficiency analysis, determining real-time fuel consumption per ton transported
- Total Fuel Used (TFU), measuring vehicle utilization, idle time, and trip efficiency
- Predictive maintenance metrics, tracking engine hours, brake usage, and wear patterns to anticipate service needs
- Driver behavior insights, such as detecting excessive acceleration, harsh braking, or prolonged idling
By leveraging Virtual Sensors, businesses gain deeper operational insights without requiring additional hardware, enhancing efficiency, performance tracking, and data-driven decision-making.